In September, 18 students, 2 teachers, and 3 kayaking guides went on a kayaking excursion along the Shem River, SC to discuss estuary ecology, water quality parameters, and shorebird conservation. The objectives for the lesson were as follows:
- Students will be able to measure the turbidity, salinity, and temperature of brackish water within an estuary and correlate the data with their previous knowledge of estuary water quality parameters.
- Students will be able to identify shore and seabirds surrounding Crab Bank, a bird sanctuary located in Charleston Harbor, and determine ways to protect decreasing sea and shorebird populations.
This field trip focused on the sea and shorebirds found in Charleston, South Carolina. Along the paddle, we identified flora and fauna found in the Charleston estuary. As we approached our destination, the class stopped to take water quality samples in 3 separate locations: Shem Creek, Golf Ball Creek, and the mouth of Charleston Harbor. At each testing location, we discussed the characteristics of an estuary, and whether our readings matched what we learned in class. In addition to this, we talked about the meaning of the data and how the water quality measurements influence adaptations that organisms would need to have to survive in that environment. When we reached Crab Bank, we stopped and discussed how to protect bird sanctuaries such as Crab Bank and the history of why these critical habitats are declining. The following day, students took a 10 question, multiple choice quiz to assess understanding.

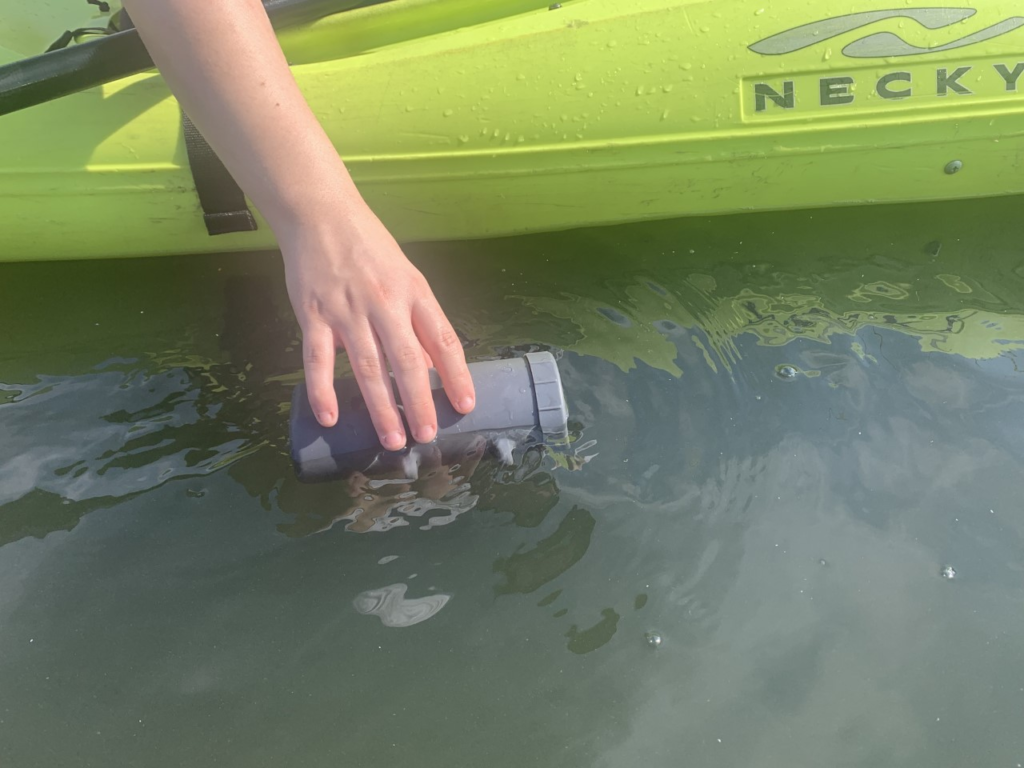
When asked about what they enjoyed about using the GaiaXus device, students expressed that being out in the field while they collected data provided new meaning to what we learned in class. They appreciated that they were able to view the data immediately after recovering the device from the water. They also appreciated how easy it was to use-they simply pressed a button on the screen of their tablet, placed the GaiaXus device in the water, and then viewed the data. They especially liked the various data points that they could analyze, which gave them a broader understanding of the water quality they were kayaking through.
Students had suggestions to improve the learning experience and suggested that new data be listed at the top of the data list instead of the bottom when the user clicks “review data”. This would reduce the amount of scrolling when viewing the data in the field. Students also suggested that the data table be more compact so the user would not need to slide the screen when reading data as managing the tablet within a plastic pouch proved to be difficult.
Overall, the device performed the way it was intended. Students were able to easily collect turbidity, depth, temperature, and salinity readings while they were kayaking. Due to the device’s simplicity, the class could focus on the learning objectives and participate in more meaningful discussion. After seeing the device in use, one of the kayaking guides said that this device was the “water quality monitoring of the future.”